
Definition of 'Accounting'
The systematic and comprehensive recording of financial transactions pertaining to a business. Accounting also refers to the process of summarizing, analyzing and reporting these transactions. The financial statements that summarize a large company's operations, financial position and cash flows over a particular period are a concise summary of hundreds of thousands of financial transactions it may have entered into over this period. Accounting is one of the key functions for almost any business; it may be handled by a bookkeeper and accountant at small firms or by sizable finance departments with dozens of employees at larger companies.Management accounting
Management accounting combines accounting, finance and
management with the leading edge techniques needed to drive successful
businesses.
Chartered management
accountants:
·
Advise managers about
the financial implications of projects.
·
Explain the financial
consequences of business decisions.
·
Formulate business
strategy.
·
Monitor spending and
financial control.
·
Conduct internal
business audits.
·
Explain the impact of
the competitive landscape.
Bring a high level of
professionalism and integrity to business.
Processes
For Accounting Management
is the practical application of management techniques to control and report on
the financial health of the organization. This involves the analysis, planning,
implementation, and control of programs designed to provide financial data
reporting for managerial decision making.
Why do we need accounting?
We need accounting because it is the backbone of business finances. It was created in response to the development of trade in medieval times.
Accounting can be:
1.
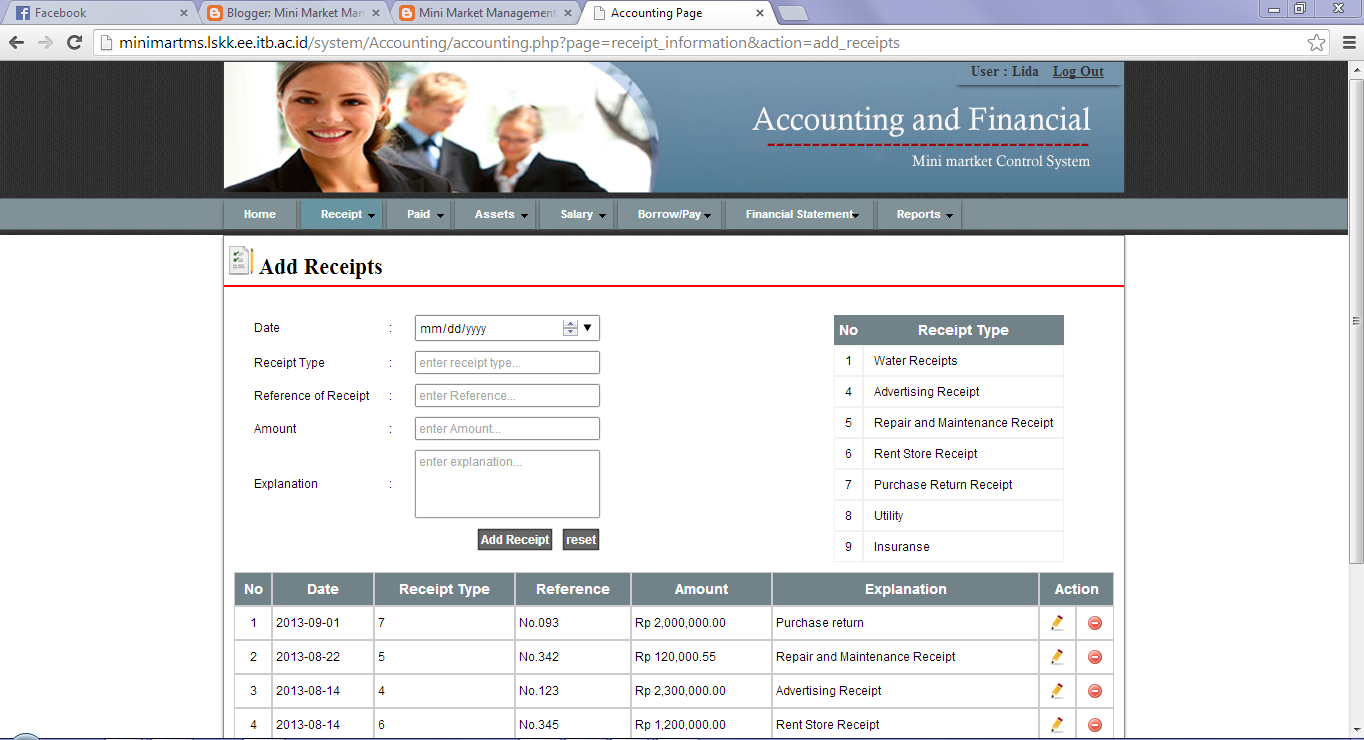
Receipt Process
Add, delete, Modify, select all receipt
2. Owner drawing process
Add, delete, Modify, select of owner drawing
3. Assets(Stuff) Process
Add, delete, Modify, select of Assets(Stuff)
4. Assets(wealth accumulation) Process
Add, delete, Modify, select of Assets(wealth accumulation)
5. Pay back Process
Add, delete, Modify, select of Pay back
6. Borrow process
Add, delete, Modify, select of Borrow
7. Pay Back from Borrow
Add, delete, Modify, select of Pay back From Borrow
8.1 Find Assets
Calculate Total Assets = ((total Profit - total Expense) + (total Assets(wealth accumulation) + total assets (stuff) + total Borrow) -
(total_Owner Drawing - total Pay Back from Borrow))
- total Profit = ['SUM(pd_PriceSold * pd_Quantity)-(SUM(pd_MainPrice * pd_Quantity) + SUM(pd_Discount * pd_Quantity)
+SUM(pd_Tax * pd_Quantity))']
8.2 Find Net Income
Calculate Total Net Income = total profit - total expense
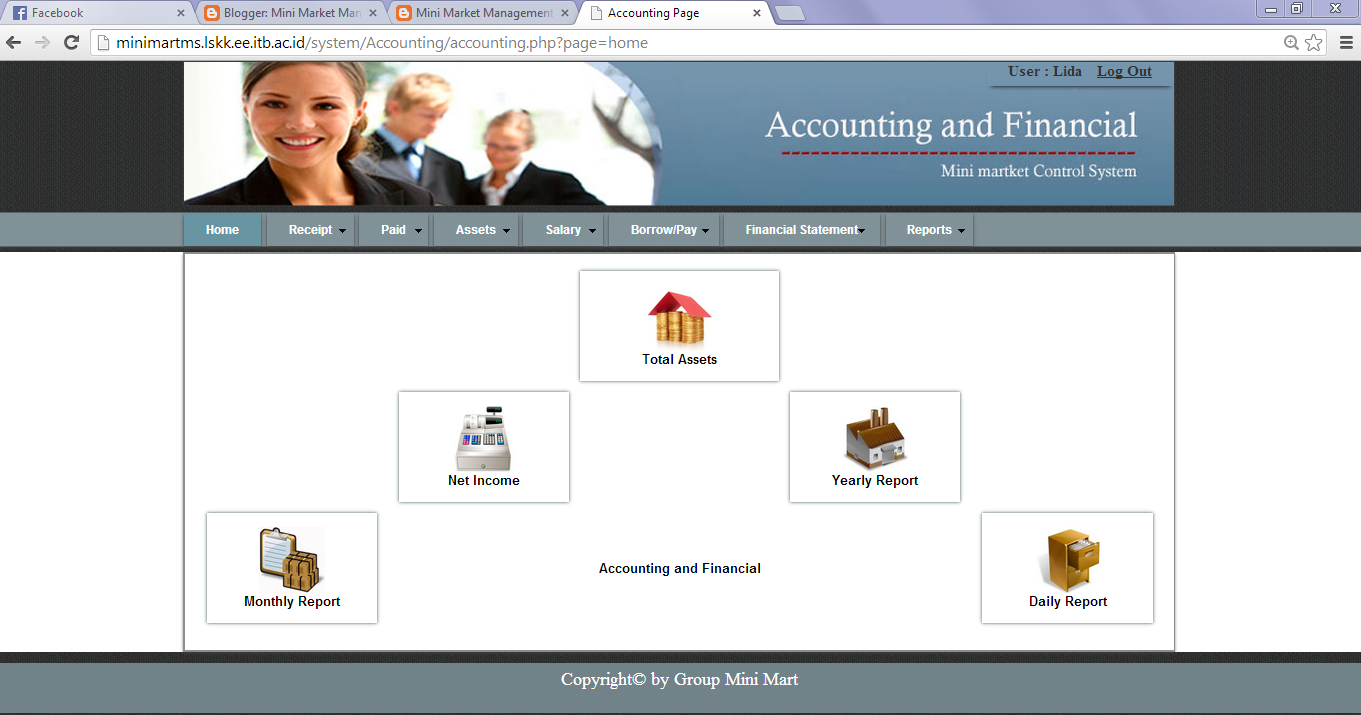
9 View Report
Data Flow Diagram (DFD of Accounting)
A data flow diagram (DFD) is a graphical representation of the "flow" of data through an information system, modeling itsprocess aspects. Often they are a preliminary step used to create an overview of the system which can later be elaborated.[2]DFDs can also be used for the visualization of data processing (structured design).
Accounting Process Level 0

Accounting Process Level 1

Accounting Process Level 2

Accounting Process Level 3

Accounting Process Level 4

Accounting Process Level 5

Accounting Process level 6

Accounting Process Level 7

Accounting Process Level 8.1

Accounting process Level 8.2

Flow Chart Accounting
A flowchart is a type of diagram that represents an algorithm or process, showing the steps as boxes of various kinds, and their order by connecting them with arrows. This diagrammatic representation illustrates a solution to a given problem. Process operations are represented in these boxes, and arrows; rather, they are implied by the sequencing of operations. Flowcharts are used in analyzing, designing, documenting or managing a process or program in various fields.
-all pages

-home page

-Receipt page

-Paid page

-Assets Page

-Salary page

-Borrow page

-Income statement page

-Report page

Web page:
A web page (or webpage) is a web document that is suitable for the World Wide Web and the web browser. A web browser displays a web page on a monitor or mobile device. The web page is what displays, but the term also refers to a computer file, usually written in HTML or comparable markup language, whose main distinction is to provide hypertext that will navigate to other web pages via links. Web browsers coordinate web resources centered around the written web page, such as style sheets, scripts and images, to present the web page.
On a network, a web browser can retrieve a web page from a remote web server. On a higher level, the web server may restrict access to only a private network such as a corporate intranet or it provide access to the World Wide Web. On a lower level, the web browser uses the Hypertext Transfer Protocol (HTTP) to make such requests.
A static web page is delivered exactly as stored, as web content in the web server's file system, while a dynamic web page is generated by a web application that is driven by server-side software or client-side scripting. Dynamic web pages help the browser (the client) to enhance the web page through user input to the server.
III. Accounting Capture
-Home page
-View receipt page

-Add receipt page

-Income statement page

Video:


